How putting minimal effort into tagging can extend the life of your UX research
Organizing your quotes through tags can help stakeholders see how users think

I realized the power of tagging when a quote six months ago helped inform our design decisions. We had gone through the laborious process of tagging our user testing and interview notes back then, and I thought it was a waste of time. But an issue arose later on about one of the things we saw during our user tests. Because we had tagged everything, I was able to go back to the research quickly, pull relevant user quotes, and show our stakeholders how users thought about the issue.
Tagging can not only help you with categorizing your thoughts while taking notes. In addition, it can be a helpful way of organizing data for future use and building UX Research at your organization. But to understand what tagging can do, we have first to point out what tagging can’t do: provide statistical data.
Understanding tagging
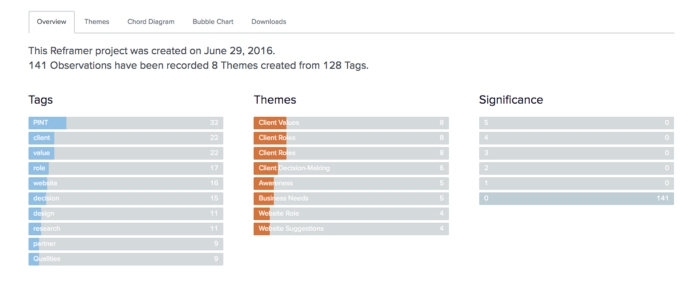
The first thing you have to realize is that you can’t get a metric from tagging. Tools like Reframer may lead you to believe otherwise, with bar charts built from the most common tags and themes.
https://uxdesign.cc/reframer-review-a-qualitative-research-tool-c99b1700af0c
However, digging into the most common tag groups yields a little more insight into why this is the case:
https://blog.optimalworkshop.com/tagging-your-way-to-success-how-to-make-sense-of-your-qualitative-research/
By far, the most common type of tags is sentiment tag. These tags identify positive and negative moments to understand where we can and should make improvements. But emotions aren’t binary. It’s possible that 6 out of 8 users felt both frustration and delight with your prototype. Some users might be frustrated with certain parts while others like them. But saying “75% of users were frustrated and delighted with the prototype” will only lead to confusion.
What we want to do instead is understand why users felt that way. But that’s not something that tags can describe. This is why many people feel like spending a lot of time tagging might not be worth it. However, that’s a misunderstanding of tags in the first place. Tags are helpful for three primary purposes:
Filtering data for more straightforward analysis
Quickly spotting patterns among participants
Building a UX Research repository for future use
Let’s go through these, one by one.
Avoid being overwhelmed by data
One of the things you have to get used to, doing user research, is getting used to staring down a spreadsheet full of data.
https://uxstudioteam.com/ux-blog/ux-research-system/
We may try and organize our data with different sorts of research systems, but there might still be a lot of additional data that we could parse through. But what if we could filter data to make it easier to read? That’s something that we can do, assuming that we use tags in software. I’m familiar with the two tools, Reframer and Evernote, but any digital notetaking tool can work.

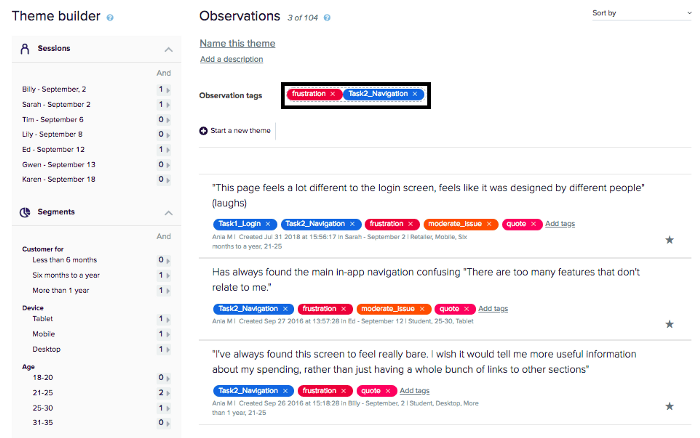
By doing this, we hide most of the data except the tags we’re interested in, which allows us to read data more efficiently. In addition, this will enable you to dig deeper into the analysis by focusing on what you’re interested in.
Focusing on certain tags also allows you to do something else: it will enable you to spot patterns across participants. So, for example, when you filter out a specific tag, you can see responses with that tag among all participants.
https://www.testingtime.com/en/blog/use-tagging-to-enrich-your-research/
For example, what things did people find positive? Perhaps one user liked one feature, while several users like another. Being able to filter data quickly means spending more time looking at patterns and tags across participants. This can easily allow you to conduct analysis more quickly. However, these are still tying tagging to the analysis phase. Are tags that helpful when it comes to presenting your findings?
The answer is yes, and it comes by following the acronym KISS: Keep It Short and Simple.
Keep it Short and Simple: some tags are more valuable than others
The simplest possible tagging structure revolves around a single tag and minimal effort but can offer you tons of value: just tag quotes.
We often have many key findings or big hits that we want to talk about, but sometimes our users tell the story better than we ever could. But it can be challenging to remember who said what, so tagging quotes is a great way to organize this information. And this ties to one of the most important things I learned about tagging: not all content is worth tagging.
Here’s a list of tags, ranked from most to least valuable in my experience:
Think-aloud quotes about the user’s workflow or thought processes
Emotions/Sentiment tags
Task metadata, such as what the user refers to (Task1, screen, workflow, etc.)
Devices or page elements specific to your product or service (Pricing, checkout, etc.)
The reason quotes are so valuable is because they often don’t just talk about your project.
For example, a user might not say, “I make sure that I have my credit card on hand for checkout.”
Instead, they might say something like, “Oh, I’m often told a model# of the part I’m supposed to order by my manager. I tend to write that down on a notepad, then I copy and paste that into the search bar. Usually I’m able to find what I need through the search process, and then I copy-paste our company’s credit card information into the checkout process.”
Users often want to give more context to particular tasks, and they may talk about their experience with the website, their mental models, and more.
As a result, if you tag your quotes and organize them, you can build a UX repository of knowledge to help support future projects, help stakeholders understand the value of UX, and be a place for other teams to gain insights.
Having your research inform the big hits of a project and help improve the UX maturity across the organization is incredibly valuable. So if you ever find yourself with the ability (or tools) to try tagging as part of your user research process, don’t be afraid to embrace it. It can not only improve your project by making analysis quicker, but it can also become a repository of knowledge for future projects.
Kai Wong is a UX Specialist, Author, and Data Visualization advocate. His latest book, Data Persuasion, talks about learning Data Visualization from a Designer’s perspective and how UX can benefit Data Visualization.


