


Don't fear data: the need for quantitative metrics


When I first started to explore Data Science, I would spend time sharing my progress, resources, and knowledge with my designer friends.
But as enjoyable as it was to learn Data Science, what was equally fascinating were the reactions that I’ve received from my fellow designers.
Some asked me if I planned to switch careers. Others thought I was learning for fun.
I was confused about these responses until I did some research that I understood why: there’s a fear, and possibly even hostility, between the Design and data. And looking at the history of the field, it’s justifiable.
UX has always struggled with other fields taking on their role.
We came from an era of engineers designing things when we were closely aligned with Human Factors.
In the present day, we have to worry about team members or developers driving Design, leading to design-by-committee.
Do we need to worry about data metrics defining the Design in the future as well?
Is it any wonder that people are worried that data might threaten the creative process (or the process overall)?
But after spending some more time with Data Science and understanding their point of view, I don’t think that there’s that much to fear.
There is a future where Design flourishes when paired with data.
We need to think about data a little differently.
Data-aware, not data-driven
One of the typical buzzwords around data is the phrase “Data-driven”: it sounds good, especially from a business perspective.
Being able to say that you base your business decisions on solid evidence is something companies hope to achieve.
But it also sounds like a nightmare for designers because it seems like it would kill creativity.
If the industry standard based on data is to have a website with blue buttons, teal navigation menus, and black text, it seems like all designers are placing elements on a page without any creative freedom.
But that sort of scenario is improbable for one key reason: those types of problems are rare.
For a problem to have a data-driven solution, the problem must be known in its’ entirety, the goal must be obvious, and the question and methods must be unambiguous.
In the real world, it is doubtful that there’s a single metric that will define decisions like that: usually, there are interconnected metrics that affect one another, which means that data will rarely drive all the decisions.
And often, those types of problems already have solutions in terms of best practices or other established solutions. As a result, if a company claims to have data-driven solutions, it’s a little bit of a misunderstanding: the problems or objectives they have may be driven by data, but their solutions likely aren’t.
In that case, we need to think about using data differently when implementing it with Design. According to Designing with Data, by Rochelle King et al., there are three different levels of utilizing data:
Data-driven Design
Data-informed Design
Data-aware Design
The first, data-driven Design, is when the data-should problems are cut-and-dried. As such, you may need to look at another level of data utilization. But this is often only useful in limited circumstances, such as with A/B testing of parts of a website.
Data-informed Design is when data is one of the primary methods (but not the only method) to decide. This is known on the Design side as triangulation.
Data-informed Design is when you would use multiple research methods or various data sources to come up with an appropriate response. As a result, if the data says one thing, but interviews and other user research says something else, the team may end up going with a method that tries to blend the multiple views.
However, there is another level, data-aware Design, that can be considered the perfect blend between UX Design and Data. At this level, design thinking is applied to the data collection process to utilize data collection in the best way possible. At this level, design thinking is used to understand the questions that need to be answered through research, how to set up data collection, what data types should be captured, and how to utilize them in the future. This level of thinking is needed to ensure that the correct data is collected to address the right questions, and it often involves others such as business strategists and developers.
To break it down more simply:
Data-driven Design is like a subway route. It follows a set path along tracks, with minimal decisions being made (such as which subway stop to get off at).
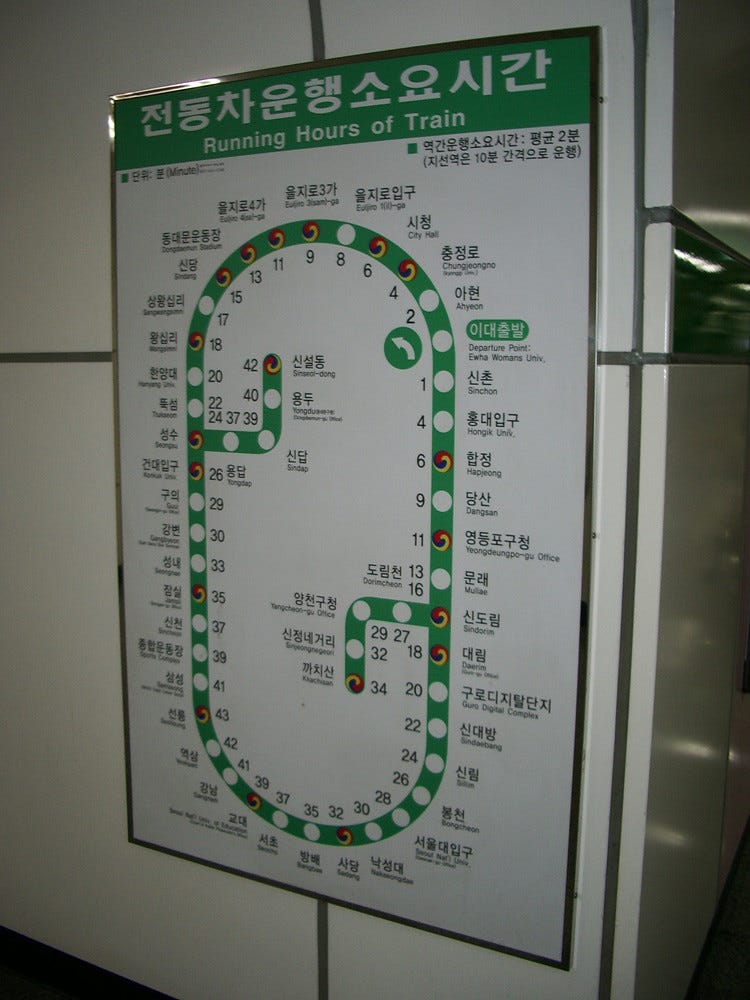
“Seoul Subway Line 2" by InSapphoWeTrust is licensed under CC BY-SA 2.0
Data-informed Design is like being at a subway station. You can take several different subway routes from there, and there’s a little more autonomy (such as which routes to take to where you want to go).

"Official New York City Subway Map" by MTAPhotos is licensed under CC BY 2.0
Data-aware Design, however, is like an intermodal transportation center like Union station.

"San Diego Union Station - California" by Loco Steve is licensed under CC BY 2.0
You could take the subway, but you could also take the bus, call a taxi, or many different options. Choosing how to approach your destination, along with what method you use to get there, is a much more involved process.
This process of learning how to use data effectively and even Design with data in mind is where you can use your intuition and experience as a designer to design excellent user interfaces and design systems for collecting and utilizing data effectively. Doing so makes the lives of your data team more manageable. It allows you to apply Design Thinking on a larger scale, creating design systems that can quickly answer future research questions and make sure you can easily collect the correct data.
But to do that, you need to bring more structure to the current design process. And that begins with a single question: How will you know if you’ve succeeded with your project?
A data-aware mindset
If you wanted to follow up with the project six months afterward, how would you know if the changes that you made succeeded with your goal?
Answering this question is a tricky thing for Designers to figure out in many circumstances. It’s something that might not even come up for some of your projects. But that doesn’t mean that it’s not essential.
If you were still part of the project and it had a budget, you might get to schedule interviews with participants to get a deep understanding of what’s changed and if it’s positive.
But what if you couldn’t? Then you would probably look at quantitative metrics.
Whether it’s sending out surveys, looking at Google Analytics, or doing benchmark testing, you would probably gather quantitative data wherever it existed and figure out how to compare it with when you first made those design changes.
Following this approach will introduce you to several areas where Data and UX can help each other. These are what I will cover in this and the following sections.
What metric matters most to our team?
How can I test for a specific metric?
How can I improve the quality of my data?
How do I get started working with data?
How do I use visualization during my Data Science process?
But first, let’s talk about the matter of scale.
How to approach quantitative metrics
When you work with quantitative metrics, you’re often working with large amounts of data.
Going from interviewing a dozen users to looking at Google Analytics data for tens of thousands can often be overwhelming.
As a result, there are a number of actions that you must take before analyzing a single variable. This is where some problems arise, and how Data Visualization can be useful.
You will be spending more time trying to clean up the data through queries. One of the trade-offs with having access to an extensive data set is that we lose the ability to manually correct errors, which means we have to rely on the data set is good quality.
Not only that, but you also need to know where to start: simply diving into a spreadsheet without a clear idea will lead to a lot of trouble.
This may only contribute to the sense of fear that Design may have when using quantitative metrics.
But Data Science offers a comprehensive process that allows you to make sense of large amounts of data, starting from cleaning up the data to asking the dataset's queries.
Journeying through Data Science has allowed me to find structure and process that has allowed me to utilize this powerful tool in my work life.
Not to mention how I’ve learned how Design can positively impact Data in a data-aware fashion.
So, where do you start with this approach? By defining your metric of interest.